


Sensor Performance and Limitations
This is Section 3.1 of the Imaging Resource Guide.
In an effort to better understand the differences that can occur between theoretical and as-manufactured lens performance, Examples 1-3 show what happens at the sensor level, and how output from the sensor is visualized with different wavelengths and f/#s. Figures transition from theoretical to real world examples that include aberrations and lens fabrication errors. As is noted in MTF Curves and Lens Performance, the shorter the wavelength, the theoretically greater the performance ceiling of the imaging system. In recent years, blue LEDs have become dependable for increasing the performance of small pixel-equipped sensors. Remember Best Practice #5 from Best Practices for Better Imaging, Color Matters. Understanding the physical capabilities and limitations of a lens at different f/#s and wavelengths helps to optimize the utility of high-resolution imagers and enables solutions to difficult applications.
Ex. 1: Variation in Spot Size and Pixel Output with Wavelength at low f/# (Theoretical)
Figures 1a and 1b show four different wavelengths being perfectly imaged, except for blur caused by diffraction (see The Airy Disk and Diffraction Limit) in the center of a sensor containing 3.45µm pixels and at f/2.8. This is considered a small pixel size, and it is associated with a very popular 5MP sensor utilized by many camera companies. Figure 1a shows the difference in spot size when stepping up from 470nm (Blue) to 880nm (NIR) wavelengths. Figure 1b shows pixel outputs for each of the images created by the lens in Figure 1a; notice smaller spots associated with shorter wavelengths.
Figure 1: Variations in spot sizes and pixel outputs with wavelength at low f/#.
Ex. 2: Variation in Spot Size and Pixel Output with Wavelength at High f/# (Theoretical)
The images in Figure 2 are like Figure 1, but the aperture setting has been changed to f/8. Figure 2a shows all the spots, regardless of wavelength, exceed the size of a single pixel, causing energy to spill into adjacent pixels. Figure 2b shows a noticeable blurring in the pixel outputs at the longer wavelengths with spots at 880nm no longer able to be separated. This shows one effect of changing the f/#, even in a theoretically perfect system.
Figure 2: Variation in spot sizes and pixel outputs with wavelength at high f/#.
Ex. 3: Variation in Spot Size and Pixel Output with Wavelength in Real Lenses Including Aberrations
This example is more realistic of the center and corner of a true lens design at f/2.8. These figures include aberrations inherent in even the highest quality lens design, and effects related to manufacturing tolerances. Aberrations misplace information and alter the shape of the spots produced, leading to spots that are not rotationally symmetric; the sum of aberrations involved create this shape (more about aberrations can be found in Aberrations. Note, aberrations are more pronounced at the corner of an image than the center. A great difference is seen in the spots shown in Figures 1a and 1b versus that of Figures 3a and 3b; Figure 1 is a theoretical demonstration, while Figure 3 uses a real lens. Notice how aberrations influence the spot shapes in the image shown in Figure 3c and 3d.
Figure 3: Variation in spot sizes and pixel outputs with wavelength in real lenses that include aberrations.
Ex. 4: Real-World Lens Performance. Actual Images.
Figure 4 is an application image that shows the difference in performance of two lenses with the same focal length (16mm), f/# (f/2.8), and field of view (FOV) (100mm, horizontal). These images show all the concepts detailed in the sections on f/# , modulation transfer function (MTF), and wavelength. The target is a multi-element Star Target that allows the concurrent visualization of a wide range of frequencies (resolutions) in common field points in all directions. More details on this target and other targets for benchmarking system performance can be found in Resolution and MTF Testing. The differences in performance can be seen by examining closeup sections of the FOV. Figure 4 shows the complete star target that is being imaged by the two lenses; the highlighted areas in the center, bottom middle, and the corner of the target are points of interest in the comparison between the two different lenses. A Sony ICX625 monochrome sensor with 3.45µm pixels and a total resolution of 5MP, and a white light backlight illuminator are used in this example.
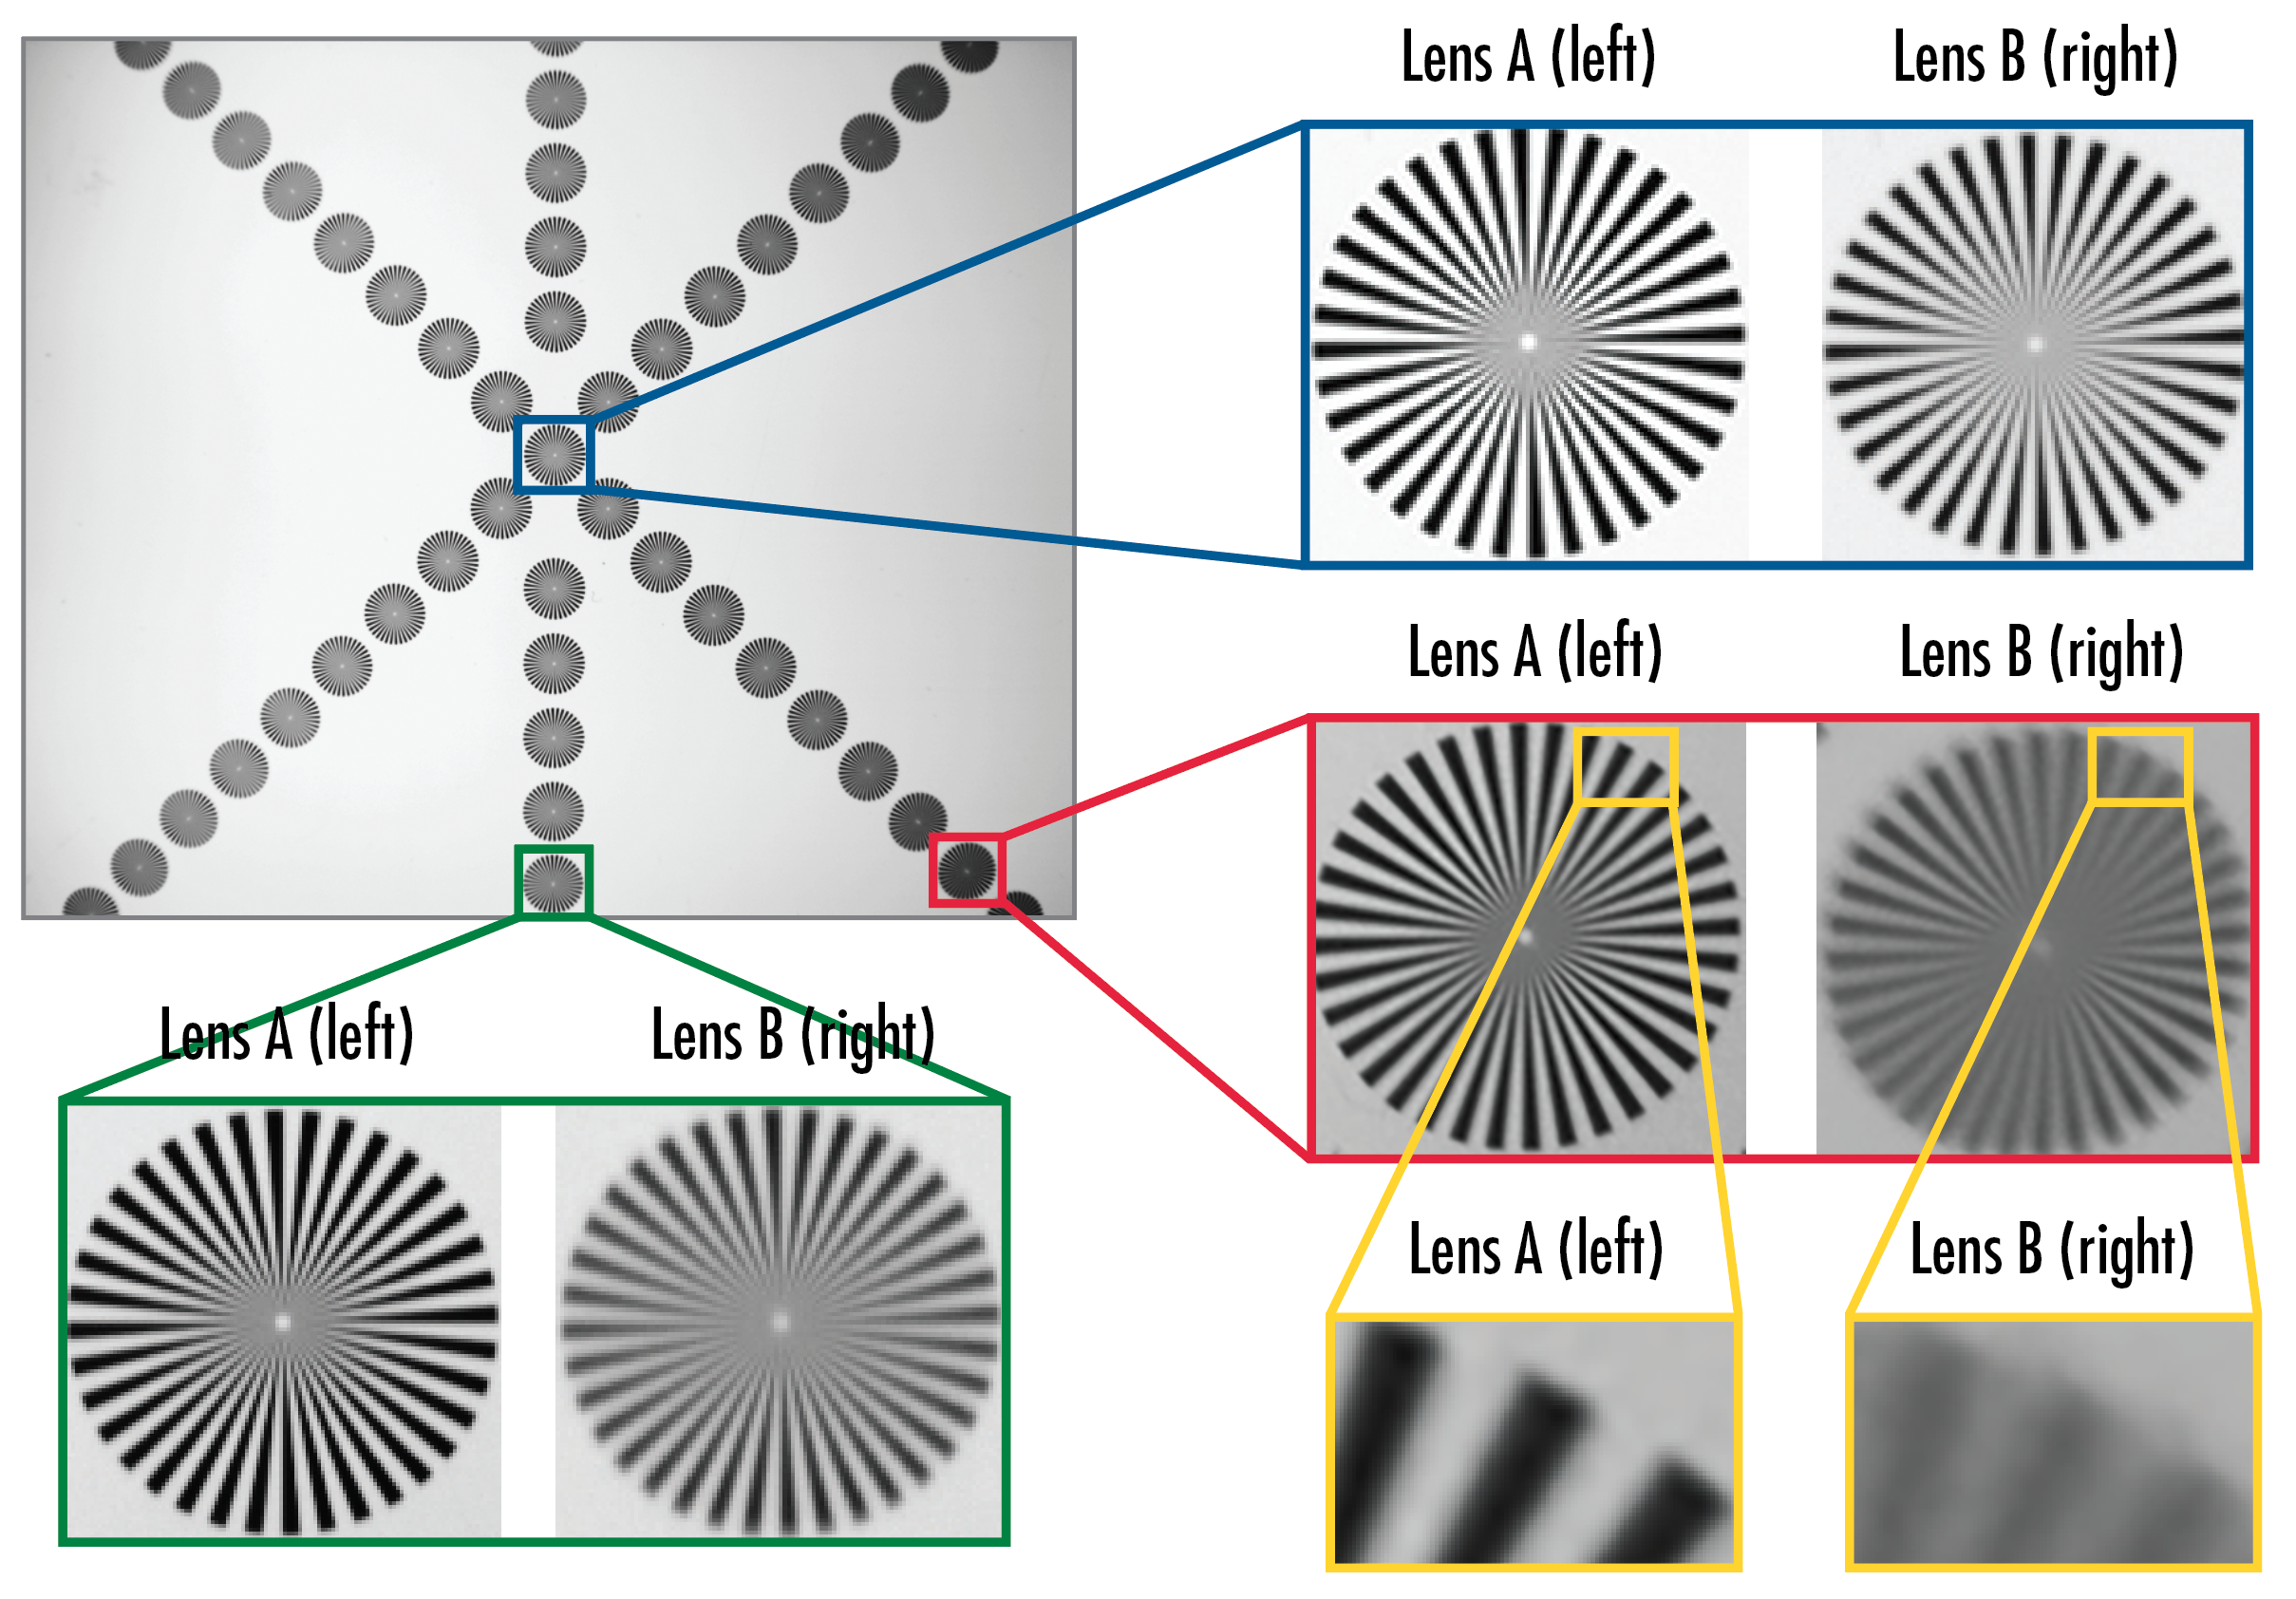
Figure 4: A star target is imaged with two lenses (A and B) with the same focal length, f/#, FOV, and sensor.
The comparisons shown in Figure 4 show lens A’s superior performance. The corner of the image shows a large difference in contrast; it is noticeably more difficult to differentiate black and white in the lens B example. Additionally, the directionality of different aberrations (mainly astigmatism) are prominent; more detail can be seen associated with lines propagating in the radial direction.
The close-up of the corner of the image in Figure 4 (yellow boxes) presents an additional concern where each black and white line pair covers approximately 10 pixels total. Compared to the resolvable portion at the center of the image, the corner has reduced spatial resolution (due to the blurred circle covering multiple pixels) from 5MP (2448 × 2050) near the center, to approximately 500 × 400 pixels in the corner, which is below what a VGA sensor (640 × 480 pixels) can reproduce. Even at reduced sensor resolution, some lenses still struggle due to design constraints and manufacturing tolerances, seen by the different contrast of each lens. The contrast level in the yellow box for lens A is 45% and 7% in the yellow box for lens B.


或查看各区域电话
报价工具
只需输入商品编号
Copyright 2023, 爱特蒙特光学(深圳)有限公司。— 广东省深圳市龙华工业东路利金城科技工业园3栋5楼 518109 - 粤ICP备2021068591号