


Tips for Designing Manufacturable Lenses and Assemblies
A successful lens design succeeds not only in the creation of a working model but also in manufacturing, assembly, testing, and implementation. Occasionally, a lens may appear to succeed in conception but fail in one of the subsequent phases of manufacturing, assembly, or testing. For this reason, it is imperative to recognize the nuances of optical manufacturing, paying careful attention to the statistical assumption of models and manufacturing practicality. Designers must consider the individual lens element geometry, the assembly setup, and the tolerancing models when creating an optic from scratch.
Geometry Considerations
Design software digitizes the optical planning process and offers tools to ease the detailed and time-consuming procedure; however, one must be aware that most optical software does not always warn of–or–prevent the user from–creating physically impossible or difficult to manufacture solutions. Remember, optical software is just a tool and the user must pay careful attention to review the outputs.
One common technique optical manufacturers use when machining glass or other materials to the final specification is to oversize the lens diameter early in the fabrication process. Anticipating the need to oversize the diameter of the lens, designers need to ensure that the edge thickness is not too small and not too sharp, such that the edge would be prone to damage. It is suggested to keep the edge thickness above ~0.7mm, at a diameter 1mm larger than the intended final diameter of the lens.
The Karow or Z-factor, which measures the ability for a lens to center itself automatically between bell chucks, also known as bell clamps, is given by:
D1, D2 are the bell chuck diameters (commonly equal to the lens clear aperture diameter). R1, R2 are the radii of curvature for the first and second surfaces. Convex and concave surfaces respectively have positive and negative radii (Figure 1).
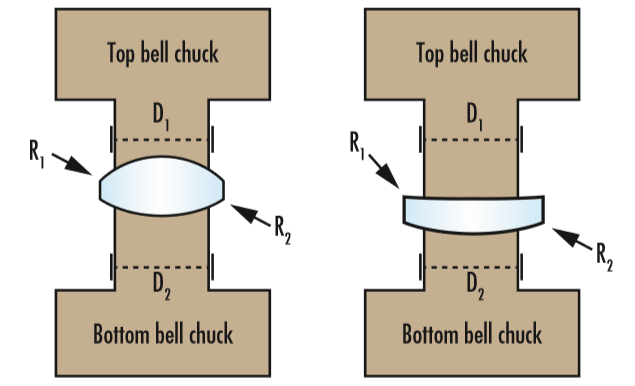
Figure 1: The left lens Karow factor (Z = 2.5) is greater than the right lens (Z = 0.4). As such, the left lens would be easier to center via automated bell-chucking while the right would be more difficult.
Lenses with a Karow factor greater than 0.56 will automatically center well via automated bell-chucking; those with a Karow factor less than 0.56 may not automatically center and will need to be centered manually. This is a time intensive process and therefore more expensive. Lenses with nearly concentric radii are difficult to center since a large amount of material must be removed to correct for surface-to-surface relative decentering. To ensure that a lens can be centered, concentricity (Δr) should be greater than 2mm as a rule of thumb:
Where CT is the center thickness of the lens (Figure 2).
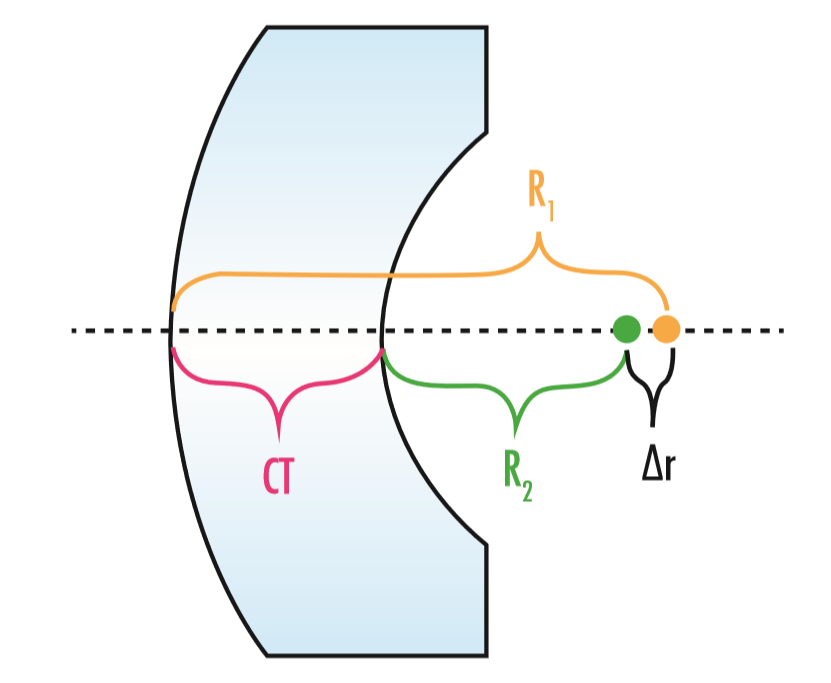
Figure 2: This meniscus lens has radii that are nearly concentric. Ensure that |∆r| is greater than 2mm so that the lens can be centered.
Lenses with hemispherical (radii of curvature less than or equal to 0.7 times the diameter) or near flat (a sag equal to or less than 100μm) surfaces should also be avoided if possible, as this is also difficult to manufacture.
Tolerancing Methods and Assumptions
Statistical modeling has become a more widely used tool in the optics industry over the last decade. Monte Carlo simulation is the most common analytical method for modeling the performance probability of an optical system. Therefore, it is important to understand the statistical models and probability distributions that may be used to control specification tolerances.
Similar to the diameter of a lens, the center thickness is usually kept intentionally thick during early stages of fabrication. This provides the manufacturer with a larger tolerance window within which to work when refining other dimensions or specifications, such as surface accuracy or surface quality, which naturally reduce the center thickness dimension. For this reason, the distribution for the center thickness of a batch of lenses will likely be skewed to the higher side of the tolerance (Figure 3).
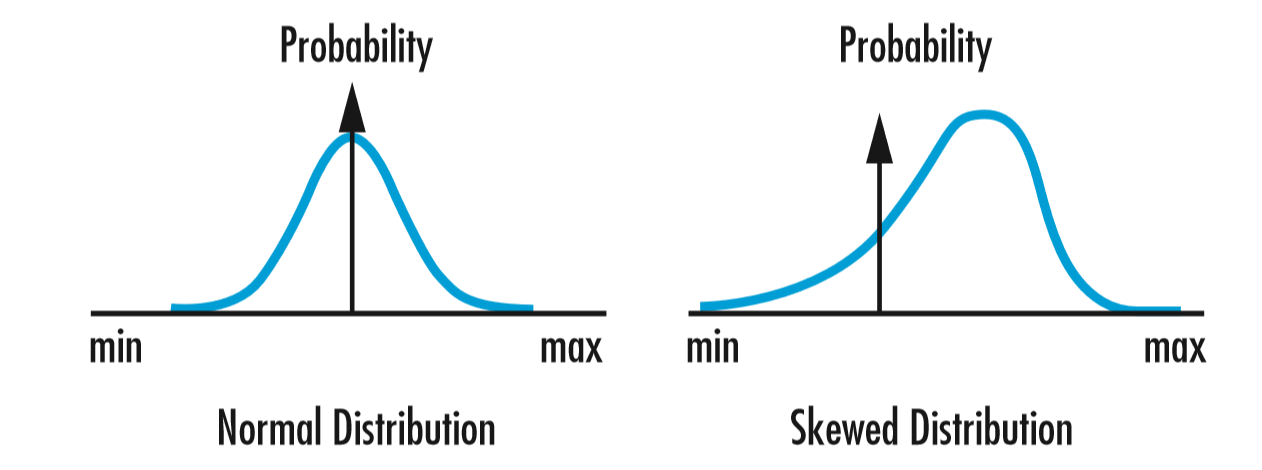
Figure 3: A lens will often be oversized to allow for downstream corrections, skewing the distribution of the value of dimensions like center thickness or diameter within a given batch
During a Monte Carlo analysis, it is often falsely assumed that the distribution for center thickness follows a symmetric normal distribution, without skew or kurtosis. The truth is that a number of factors actually influence the shape of the distribution, including the number of lenses in the batch, the fabrication process (e.g. diamond turning vs batch process), and a particular technician’s style. A sensitivity analysis can help reveal which factors have a greater impact on the design and can help designers prioritize their focus.
Modeling Surface Irregularity
Surface irregularity (SI) modeling can be as simple or complex as needed. Two commonly used simplified SI models include fitting a surface to either a 50/50 combination of spherical aberration and astigmatism or 100% astigmatism. Disregarding coma, trefoil, and other higher-order effects are not recommended for lens assemblies with a large number of elements or for optically sensitive systems since simplified SI models often do not sufficiently reproduce the wavefront error or irregularity in the system. Fitting real surface irregularity maps to Zernike coefficients is a modeling method with much higher accuracy, and most design software include this tolerancing functionality (Figure 4).
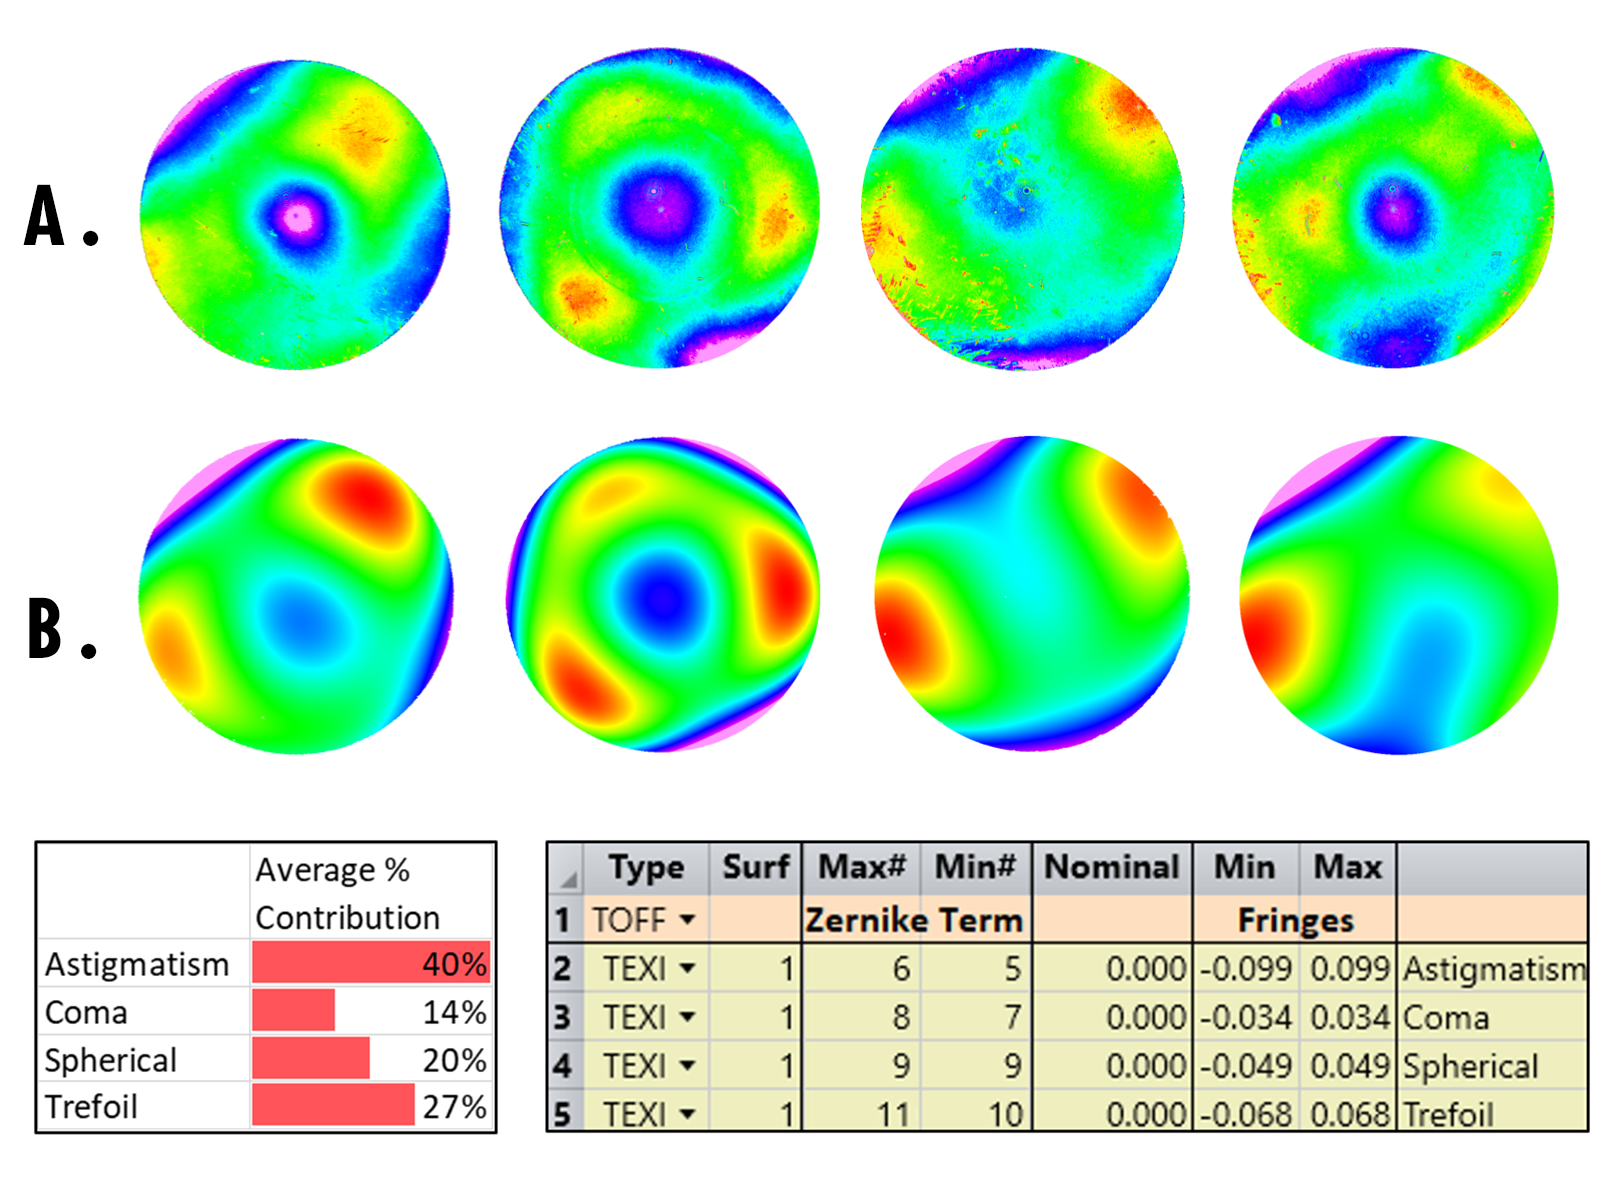
Figure 4: A. Four surface irregularity patterns based on the 5th to 11th Zernike coefficients. B. The approximate models fit to Zernike coefficients simulated in Zemax OpticStudio.
This modeling method does require surface measurements of the lenses, resulting in additional time and effort, and therefore expenses. It is also important to understand exactly which Zernike scheme a lens design software uses. There are many Zernike schemes, all inconsistent with each other, and with slightly different expressions and coefficients. The Standard (or Noll) Zernike and Fringe Zernike schemes are just two Zernike schemes often used in lens design.
Stack-ups of Assembled Systems
Manufacturers assemble lenses into assemblies and must be able to ensure that groups of lenses still perform within specification, even with tilt and decenter effects that may be present. Optical assemblies require additional attention to individual element wedge and tilt as well as system-level stack-ups as elements and spacers push against each other but are subject to limitations of the inner diameter of the barrel. Stack-up models should attempt to accumulate tilt and decenter effects, while keeping elements anchored to the optical axis, for additional accuracy. To model a system, ensure each Monte Carlo iteration is configured with the correct stack-up of element tilts according to the element arrangement in the assembly (Figure 5).
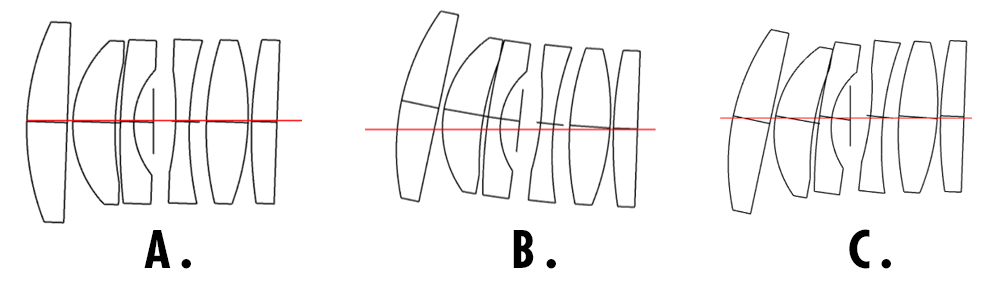
Figure 5: Three approaches to lens element tilt in a drop-together assembly. All elements are tilted by 2° in the same direction to illustrate the differences. A. Tilts are modeled independently. B. Tilts and decentration are accumulated in the order of assembly. C. Tilts are accumulated in the order of assembly, with no additional decentration; this motion is called shearing.
Roll and decenter of an element can affect subsequent elements in the barrel. Connected elements will be “coupled” to a single rolling element and will move together. Only elements with convex rear surfaces contacting spacers have a coupled decenter. Elements with annuli or flat surfaces resting against a spacer can move independently (not coupled) from an initially decentered element (Figure 6).
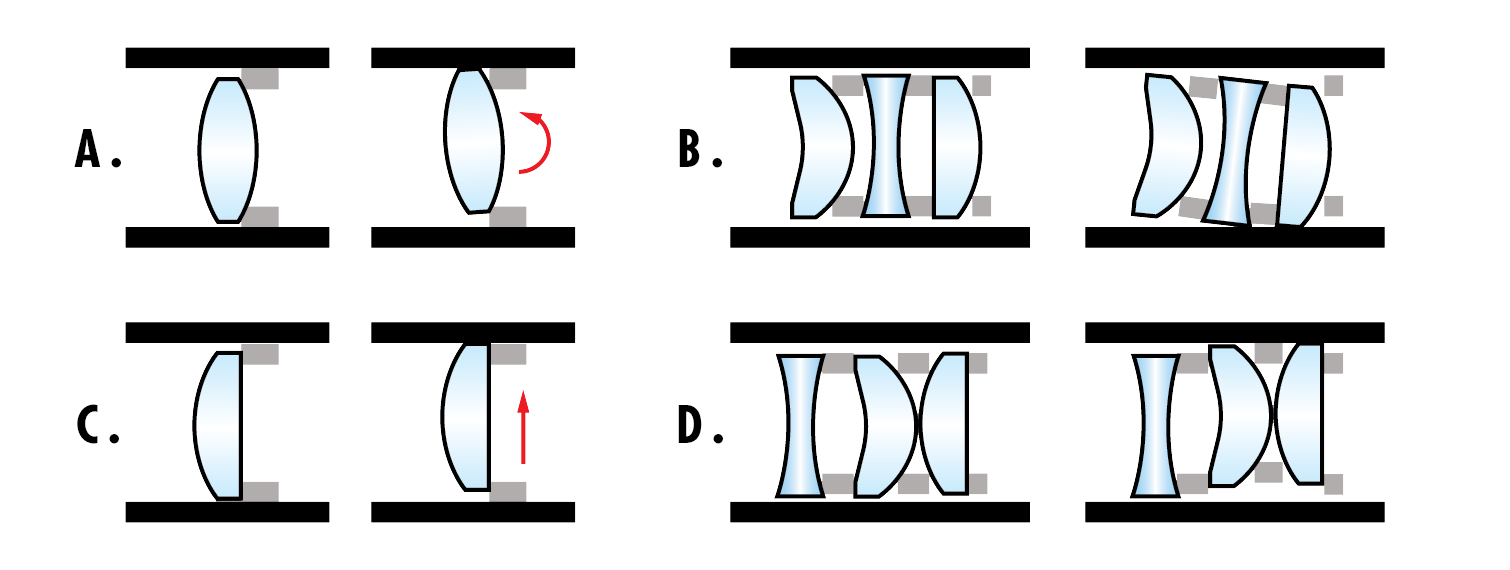
Figure 6: A. Roll motion of a lens element. B. Coupled roll motion. C. Decenter motion of a lens element. D. Coupled decenter motion.
Depending on the application for which the assembly is designed, roll and decenter may largely–or not at all–affect performance. Tolerancing the components, however, can provide valuable insight into the possible assembly process and may aid in alternative methods, such as grouping different elements together into sub-cell assemblies or installing elements in a different order, should alternatives be needed.
Oversimplifying tolerance models and designs can overlook possible manufacturing issues, but doing so increases the chances that designs will need revisions or additional iterations with increased levels of complexity. Moreover, assemblies may be manufacturable, yet yield poor, non-robust products that fail to meet design specification. Such instances inevitably extend the life of a project and increase its cost. Increasing system model accuracy and using high-fidelity tolerancing methods early in design will require additional effort up front, but will reduce expensive mistakes and save time in the end.
Looking to learn about optics and optical design?
Learn the basics of optics needed to begin designing optical systems in this educational, online Fundamentals of Optics course co-created by Edmund Optics and Zemax. It does not require any previous knowledge in the field of optics.
References
- H.H. Karow (2004). Fabrication Methods for Precision Optics. J. Wiley & Sons, Inc.
- R. Bean (April 28, 2017). How Companies Say They’re Using Big Data. Harvard Business Review, https://hbr.org/2017/04/how-companies-say-theyre-using-big-data.
- M.I. Kaufman et al. (September 19, 2014). Statistical distributions from lens manufacturing data, Proc SPIE 9195, Optical System Alignment, Tolerancing, and Verification VIII, 919507; https://doi.org/10.1117/12.2064582.
- Zemax LLC (2018). Zemax OpticStudio 18.4 User Manual. Kirkland, Wash.
- Synopsys (2018). CODE V Tolerancing Reference Manual. Mountain View, Calif.
或查看各区域电话
报价工具
只需输入商品编号
Copyright 2023, 爱特蒙特光学(深圳)有限公司。— 广东省深圳市龙华工业东路利金城科技工业园3栋5楼 518109 - 粤ICP备2021068591号